Project DIVSPOT (2026-2030)
RCF funding received for non-parameteric analysis of large scale point pattern
Recent advances in data collection have transformed many scientific fields. In forestry, we can now map millions of individual trees across large regions, while in medical research, modern imaging techniques provide detailed data on the locations of individual cells within human tissues. These datasets are extremely rich, but also statistically challenging to analyze.
Traditional spatial point pattern methods were developed for much smaller and more homogeneous datasets, and they are not well suited for the new large-scale datasets with various heterogeneities and non-stationarities annoyingly breaking conventional assumptions. Yet, in practice, it is precisely these local variations — such as changes in species composition, mark distributions, or point-to-point interactions — that is often of greatest scientific interest.
In my Research Council of Finland project DIVSPOT, we develop new statistical methods to quantify local diversity directly from point-level data and to automatically detect areas where diversity is exceptionally high or low. These tools can be applied, for example, to identify forests with high conservation value or to detect biologically meaningful patterns in tumor microenvironments.
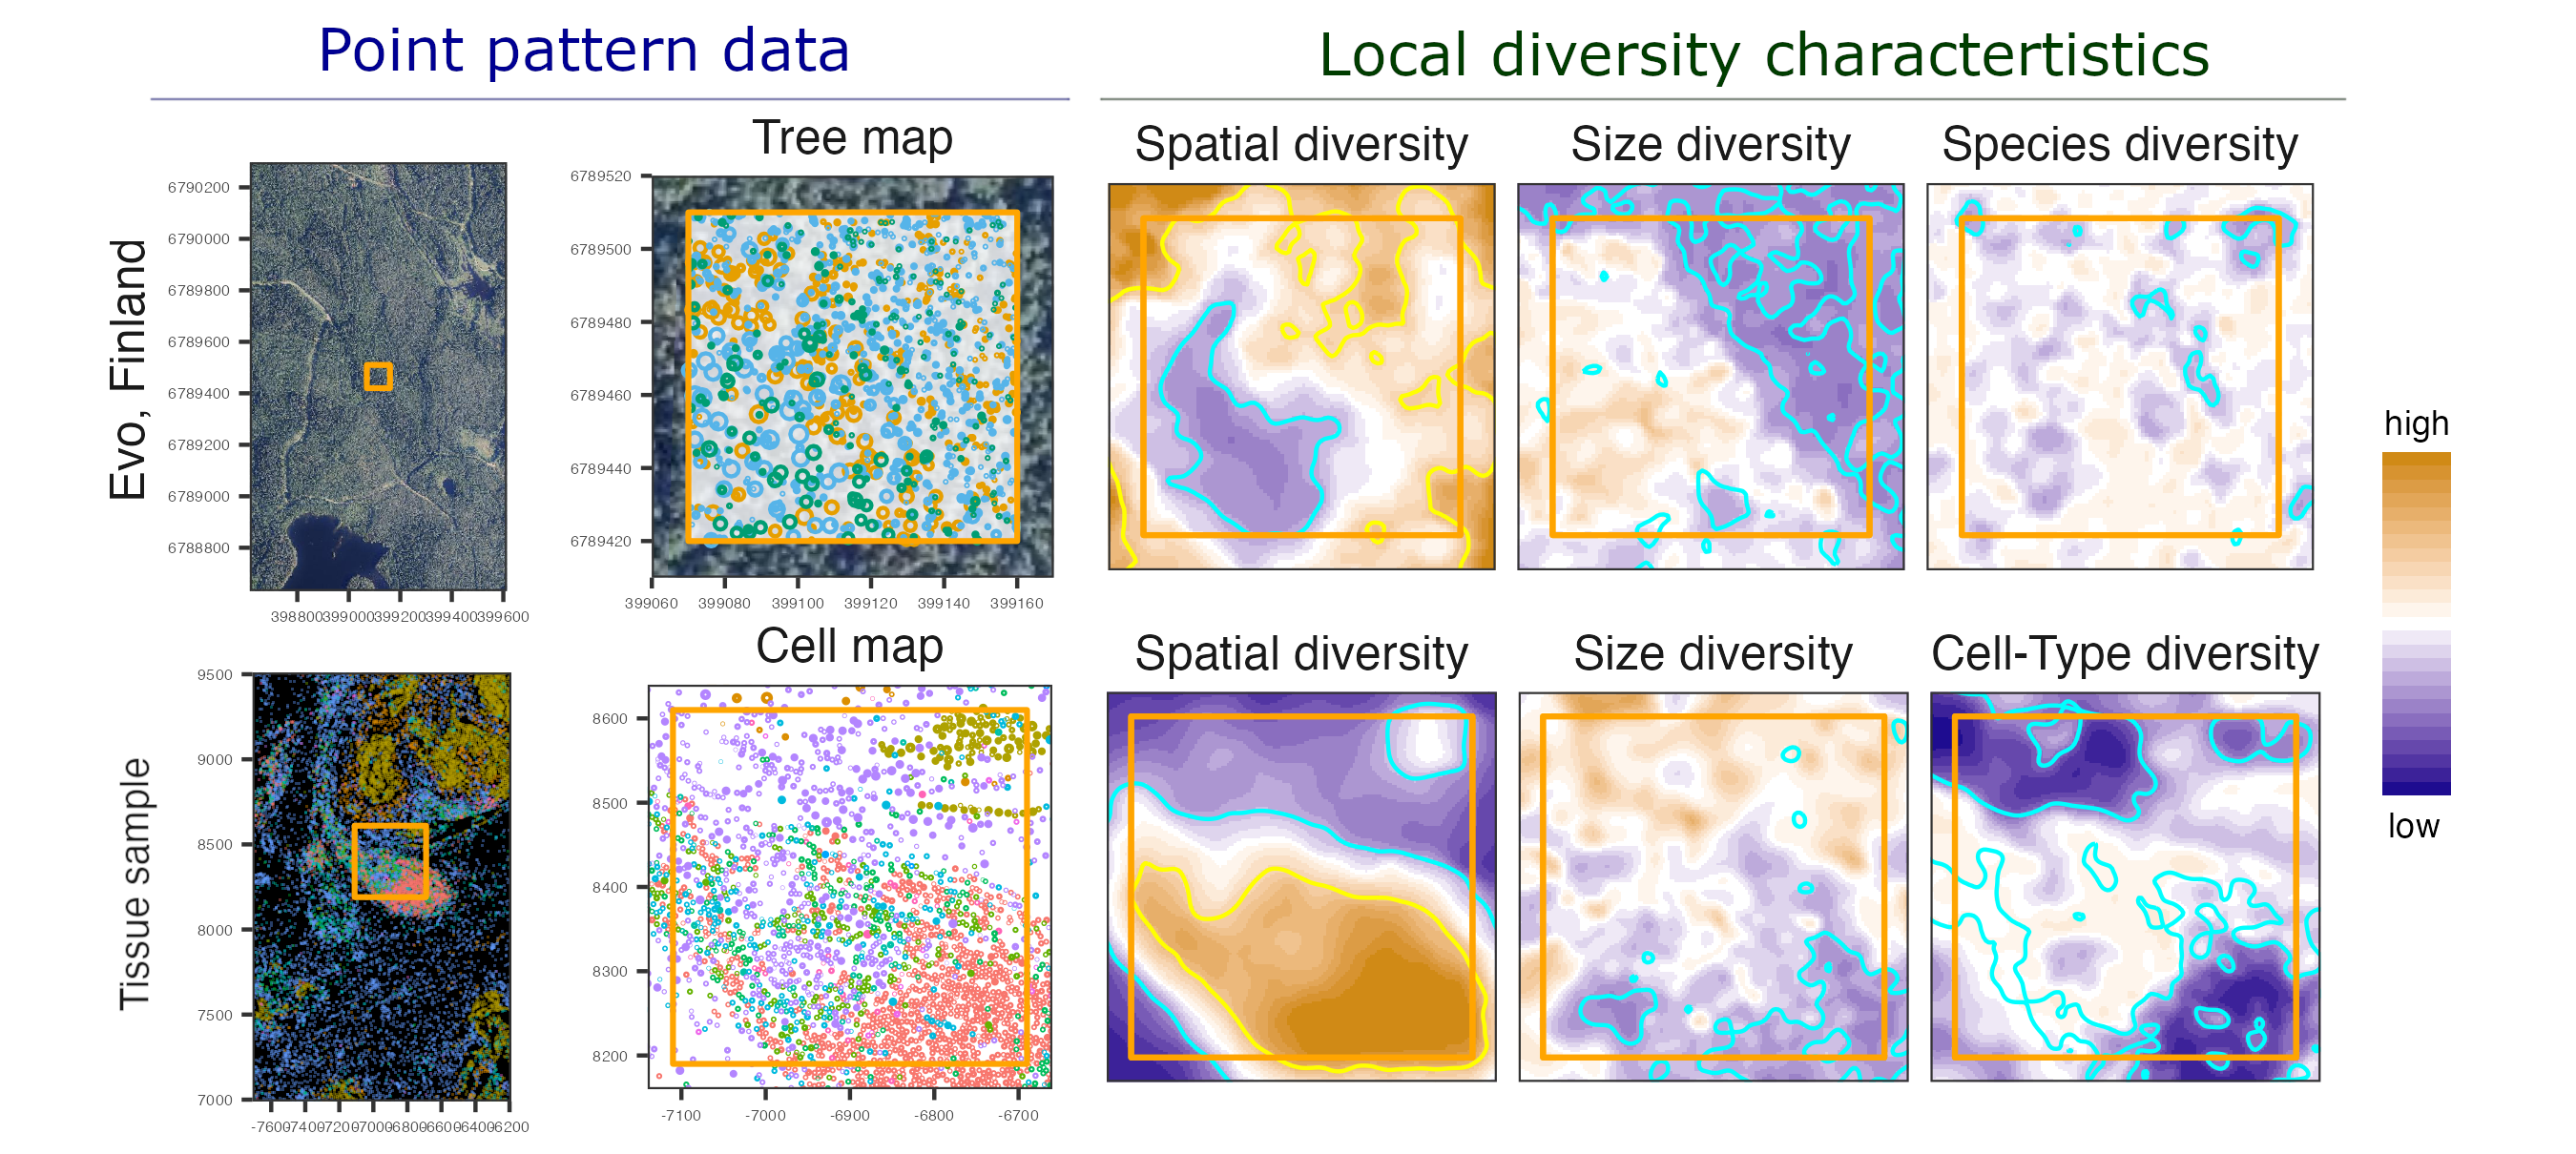
We aim to improve the production of maps that describe diversity across the region of interest. Current approaches often rely on aggregating data into fixed grid cells, which inevitably loses much of the fine-scale information. By working directly with point patterns, the new methods make it possible to fully utilize the detailed structure of the data and to separate meaningful ecological or biological signals from technical artefacts.